Data Visualization Infographic Design Services

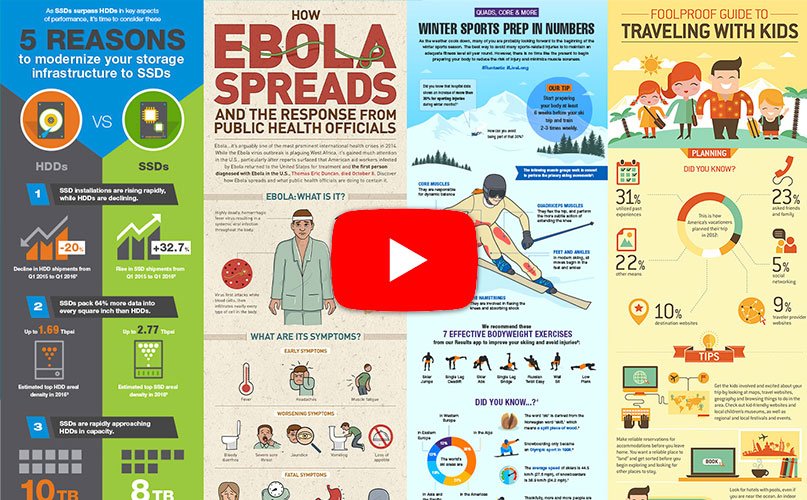
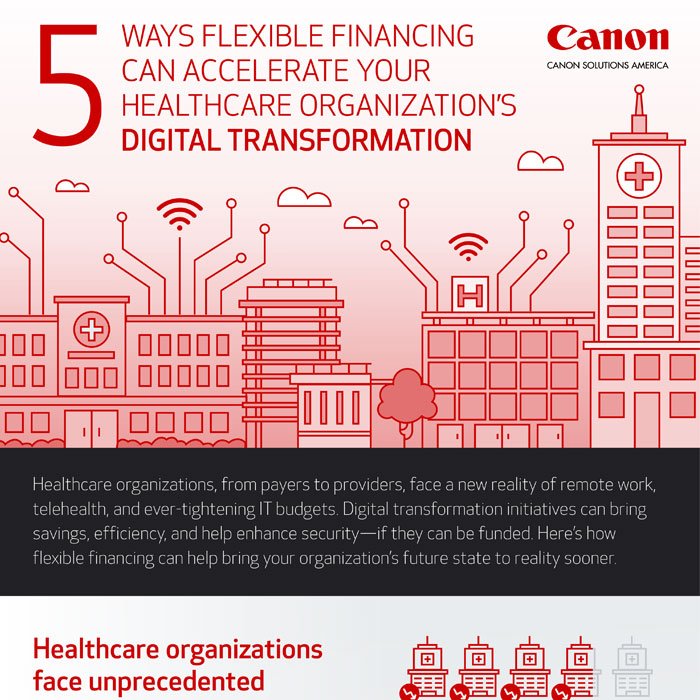
In 2018, Infographics emerged as the most successful visual format, capturing a dominant 40% share. However, marketers encountered a significant challenge in consistently creating compelling visuals. Are you grappling with a similar issue? Fear not, as we have the perfect solution for you. Visual Best has a team of expert data visualization designers who craft compelling information graphics that both explain and captivate audiences on specific topics through an alternative medium. Interested in discussing our infographic design services with a specialist? Reach out to us at info@visualbest.co!

Give Your Data a Voice

Conducting exceptional research and uncovering insightful data is just the initial phase of your responsibilities. The subsequent crucial step involves leveraging data visualization to transform your numerical findings into impactful and influential elements. Visual content, such as infographics, is processed 60,000 times faster than text. Whether you're presenting a research study, assembling an investment deck, or aiming for a viral blog post, incorporating information design can significantly enhance your impact. Moreover, translating your data into image-based visualizations is likely to result in double the social sharing.

We provide services for:
  • Interactive Infographics Design
  • Infographic Presentation Designs
  • Infographic Report Design
  • Infographic Annual Report
  • Infographics PPT design
  • Infographics deck design
  • Data Visuals for Web Infographics
  • Data Visuals for Magazines
  • Data Visualization for publications

Our Featured Works

Canon

Cloudamize

Desalitech

Dun & Bradstreet

Green Energy

Intel

Mix

Sungard

Vegetarian

Why Choose Us?

Visual Best offers data visual infographic services in Noida, India, renowned for its excellence. Our creative team is wholly committed to aiding clients in effectively promoting their businesses, products, or services. Through the seamless integration of creativity and strategic thinking, Visual Best empowers clients to differentiate themselves in the market, capturing the attention and loyalty of their target audience.
Top-notch Quality
Top-notch Quality
We provide data visualisation services for digital marketers, SMEs and enterprise clients and help them promote their brands.
Super Responsive
Super Responsive
Visual Best aligns with highly responsive project managers dedicated to fostering prompt and transparent communication with our clients. Our response time is 1 hour by email or phone calls.
Higher Expertise
Higher Expertise
Visual Best brings exceptional expertise to expedite and enhance your projects. We deliver quick and professional results and provide valuable guidance for projects.
No Timezone Challenge
We involve efficient communication, flexible scheduling, and technology to bridge the gap and ensure smooth collaboration regardless of time zone disparities.

Why Do You Need Data Visual Infographics?

People and companies use infographic design services because infographics are a simple and effective way to share information. They use small bits of important info and pictures, like charts or graphs, making it easier to understand. Since people like pictures more than long text, infographics grab attention in our digital world filled with information. They're widely shared on social media and other platforms for marketing and branding. Bloggers and marketers use infographics to engage their audience and boost website rankings. Contact Visual Best to discuss your visual story challenges with us, and we'll help you tell your brand story effectively with stakeholders with the help of our business infographics design services.
Why Do You Need Data Visual Infographics?
Contact Us

We are very quick to respond.
Why don’t you give us a try?

Mail

Mail Us at

info@visualbest.co

Phone

Call Us at

+91 85956 73328

+91 93544 42732

    Frequently Asked Questions

    Data visualization is the representation of information through visual elements like charts, graphs, and maps. It helps in understanding complex data, identifying patterns, and making data-driven decisions. Visual Best's services specialize in transforming data into compelling visuals for enhanced comprehension and communication.

    Visual Best provides a range of services including statistical infographics, timeline infographics, comparison infographics, process infographics, geographical infographics, hierarchical infographics, flowchart infographics, interactive infographics, statistical distributions infographics, and network infographics.

    Effective data visualization can simplify complex information, facilitate quicker decision-making, identify trends and insights, enhance communication, and make data more accessible to a wider audience. Visual Best ensures your data is presented in a visually compelling and impactful manner.

    Absolutely! Visual Best understands that each project is unique. Our team works closely with clients to create custom data visualizations that align with their goals, data complexity, and target audience.

    Visual Best caters to a diverse range of industries, including but not limited to finance, healthcare, technology, marketing, and education. Our team is well-versed in adapting visualizations to suit the requirements of various sectors.

    The timeline for a data visualization project depends on factors such as the complexity of the data, the type of visualization needed, and client requirements. Visual Best works efficiently to meet deadlines while ensuring the quality and effectiveness of the visualizations.

    Yes, Visual Best can create interactive data visualizations that allow users to engage with the data. Additionally, we optimize visualizations for easy sharing on various platforms, ensuring maximum reach and impact.

    To get started, simply reach out to us at info@visualbest.co. Our team will discuss your project requirements, goals, and timelines to provide you with a tailored solution that meets your data visualization needs.