+91 96504 08093

Infographics
How Can Infographics Improve Your Digital Marketing Plans?

In today’s digital marketing industry, infographics are more than just a way to present information. They’re a bridge to fill your audience’s understanding gap. And just like any form of art, they come in various forms to suit different data types, each telling its own story. Each variety serves a different purpose of uniquely conveying information.
The visuals in an infographic do the heavy lifting—they’re not just there for show. They convey meaning, sometimes without a single word, using icons, graphs, or charts. This combination of visuals and text makes infographics such an impactful tool. They don’t just inform; they excite, enlighten, and entertain, turning data into a captivating visual journey.
Here’s a blog presenting everything one needs to know about infographics:
What is the Role of Infographics in Digital Marketing?
As the term suggests, info + graphics represents information, ideas, or data through graphics, like graphs, charts, illustrations, and icons. With minimal text usage, infographics convey information without adding chunky paragraphs.
Brands worldwide consider infographics the prime tool for their visual communication with audiences. They boost engagement and support SEO even with content not previously appreciated.
Here are some of the major roles that Infographics play.
- Infographics are highly suitable for presenting statistics in a visually pleasing and digestible format.
- They help brands create content that stands out by stunning visuals and valuable SEO support.
- Infographics focus on points that need to be highlighted in a way that doesn’t bore readers and make them memorise them well.
- The infographics’ layout spreads brand awareness and reflects the brand identity through the colour scheme, font, logo, and contact information.
7 Most Popular Types of Infographics
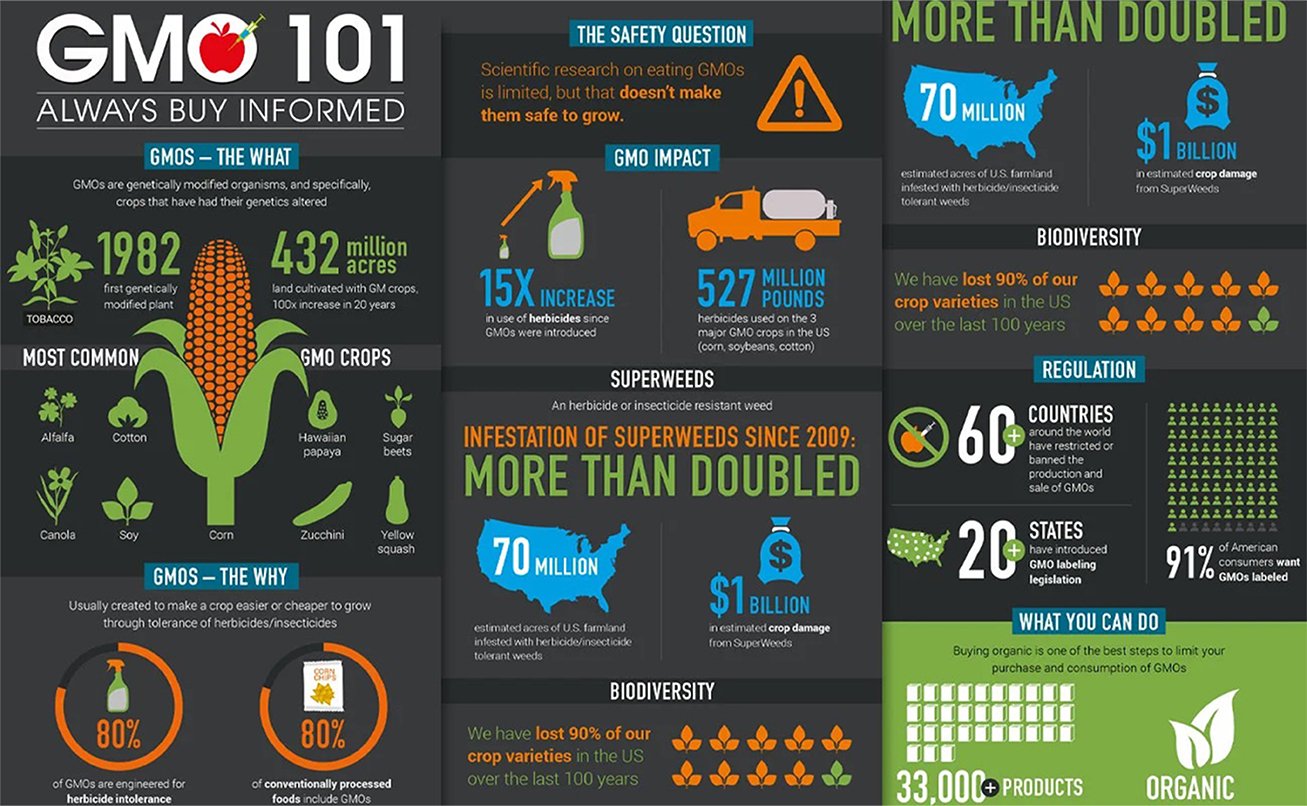
1. Visual Data Infographics
This type of infographic presents complex statistical data in a visually pleasing format. It includes components like graphs, charts, and icons to facilitate content communication primarily used to highlight trends, compare numbers, and present research data. Business reports, academic research, and media often use them to deliver information effectively.
2. Flow Chart Infographics
The flow chart category includes infographics that visually teach or inform about particular processes, workflows, or systems. These infographics offer a sequence of steps leading towards a logical flow and graphics to explain the topic extensively. They are ideal for simplifying complicated relationships between parts and showing the order of operations using texts and symbols like arrows and lines. These often represent multiple conditions and decisions based on them.

3. Process Infographics
Process Infographics are like the visual version of a recipe for how to do something. They show you a step-by-step process, making it easier to understand. These are best for explaining how things work, whether for business purposes, how to put something together, or even how a system operates.

4. Comparison Infographics
Comparison Infographics, as the name suggests, portray comparisons between or among two or more subjects. These often include charts or graphs comparing features, prices or benefits of products side-by-side. These infographics make looking at several pros and cons easier, making decision-making simpler.

5. Diagram Infographics
Diagram Infographics are graphics that use diagrams to simplify and show information clearly. They combine pictures, icons, arrows, and text to explain how different parts of a system or concept are connected. These infographics are great for breaking down complex ideas into understandable pieces, making them easier to grasp.

6. List Infographics
List Infographics are like visually engaging checklists. They break down information into bite-sized points, often accompanied by icons or images. They’re the endgame for summarising tips, steps, or information where order isn’t the main focus. List infographics help make quick reads more exciting and memorable, like in how-to guides, top 10 lists, or quick reference sheets.

7. Timeline Infographics
Timeline Infographics are visual timelines that map out events or steps over time. They’re great for telling stories or showing the history of something in a clear, linear way. They help lay out sequences, like the milestones of a project or the steps in a process, in a way that’s easy to follow and understand.


Add Infographics to your Content Marketing Strategy
Adding infographics to blog posts and topping them with statistical or timeline infographics makes complex data understandable and exciting. Besides, they are also powerful tools for good email marketing. Highly informative or minimally promotive infographics can convey brand updates, new offers, or FAQs.
Infographics can also strengthen customer-brand relationships. I gained insights from customer service regarding the questions they receive frequently.
Post Infographics on Social Media Platforms as Visual Posts
If your designer is creative, why not show it to the world? In the era of social media, where every talent receives the deserved attention, why not make the most of these infographics? Infographics grab users’ attention through graphics and provide value through the content. Many look for free resources to learn industry-related information and facts; infographics are a boon. You can share infographics with some data and content, or a standalone infographic can also be used.
Besides, it is notable that one size doesn’t fit all, which means you don’t have to be everywhere at once. Choose the social media platform that is best for your brand.
If your brand prefers to post short-liners, Twitter or Instagram threads might be your best choice. However, if your brand has to post visual content like that for a bakery or hairdressing salon, platforms like Pinterest or Instagram will be your game-changer. Using LinkedIn to post your business-related updates, milestones, or informational content is also a great way to make your brand stand out.
Make Infographics more Searchable and Optimised with Alt Text.
Alt text is the written version of an image or any visual post. It explains what the picture shows when it doesn’t load or takes time. Today, photos and text-based content are equally important, and thus, it is essential to utilise both to their full potential. Thus, using alt text with images is a creative way to engage.
Involve Good SEO Practices with Visual Post
Discussing alt text and knowing enough about good SEO practices is essential. The image explanation as alt text is not enough. You need to apply the necessary SEO keywords to make it more optimised, as mentioned below:
- Write the alt text description in under 125 characters.
- Be precise and clear.
- Try to describe it in the simplest way possible.
- Research and try using a long tail keyword in the description.
- Don’t add unnecessary words like “here is a picture of”. Come to the point.
- Don’t make it keyword stuff.
Applying these rules, one can easily craft an easy-to-understand and clear alt description. The goal should always be to make it more accessible for the audience while making it search engine-friendly.
Create Infographics Prioritising Target Audience
While designing content for your brand, it is essential to analyse what your target audience might want to look at, what kind of content they’d like to read, or what problems they face. Again, asking customer support is the best way to learn more about your customer base. Surveys and audience demographics also help to analyse them more closely.
Once you grasp what your audience wants, you can move forward with the infographic creation. Whatever topic you cover, avoid using an extensive term.
Make Sure to Reflect Your Brand in Your Creations.
When designing infographics, you must ensure your brand voice and intent align. This alignment portrays brand consistency and ensures your message resonates with your target audience. It also lets the audience know what to expect from the brand and its content.
Now, how do you do it? Keep your brand’s colour scheme in mind. Refer to the website or logo. Use design, font size/style, and colour coordination to maintain a constant brand image across all platforms.
Repurpose the Content
Creating fresh content is not always the best idea; sometimes, it is better to reuse the pre-existing content. There might be a blog or a post that performed outstandingly, reusing its content into a compact form like infographics. It grabs people’s attention through its visually pleasing style, using already-researched information.
It saves you tons of time, as the content is well-researched and received with love from the audience. All you need to do is trim and optimise the content as short-form content.
Make Your Infographics Visually Impressive
People like to decide what they should buy. And they don’t like it when someone is forcing them to buy. If you directly come to the point of selling or promoting your brand, the audience won’t be able to see the end of buying. However, if you provide value to them through informative content that is visually appealing infographic, they’ll eventually feel your content is relatable.
For promoting and selling your services, forget about promoting and selling. Learn the art of earning a promotion. Target a query that audiences generally ask. Then, write content or design infographics surrounding it; at last, provide a solution that you provide, such as services that can solve their problem directly. That’s how people like to be addressed and pleased.
Boost Your Backlink Game
By creating shareable infographics, brands can strengthen their profile by backlinking. Sharing valuable, in-depth content through infographics makes it easier for other businesses to reshare it. Brands like to share awareness-spreading or simply informative content to hook their audience.
Activities like backlinking help boost the website’s overall traffic. SERPs consider this a token of trust and take confidence in ranking you. This link-building approach is quite a common SEO practice, which includes publishing high-quality content through something broadly shareable, like an infographic.
Benefits of Using Infographics in Digital Marketing
1. Fosters Deeper Understanding
Infographics turn complicated data and concepts into easy-to-understand, digestible visuals. They establish a deep understanding of the topic. Even with little information, infographics build more precise knowledge than a whole chunk of content.
2. Enhances Engagement
Visual content is more engaging than text alone. Infographics, with their blend of colours, graphics, and minimal text, capture attention and keep the audience hooked. This can increase time spent on your website or social media pages, fostering better engagement.
3. Easily Accessible & Shareable
Infographics are artistically created that are easily accessible and shareable. They can be easily embedded, downloaded, or shared on social media, making them a powerful tool for virality. This accessibility increases your content’s reach and can drive more traffic to your digital platforms.
4. Search Engine Optimised
When done correctly, infographics can be an effective SEO tool. By incorporating relevant keywords, alt text, and file names, you can optimise your infographics for search engines, improving your website’s visibility and ranking. Moreover, high-quality, informative infographics can generate backlinks, further enhancing SEO
10+ Interesting Statistics Every Marketer Should Know
No. 1 Choice in Marketing Strategy

- In a survey conducted by Venngage, 56% of online marketers prefer using attractive visuals in nearly all their content.
- 37% of these visuals are infographics.
- Moreover, the data indicated that infographics consistently deliver the best performance results compared to other types of visual content.
- Besides, infographics with good visuals increase the organic website traffic rate by up to 12 %, as 65% of the total people are visual learners. However, it is also true that even a good design cannot prevent the failure of trash content.
Increases Readability and Memorability
- According to Visme, Infographics use vibrant colour schemes, vivid images, and design patterns, increasing the user’s attention span by 82%. These visual elements make it easier for users to store information in memory.
- Psychologists worldwide claim that approximately 55% of readers prefer reading content with attractive visuals rather than simply black-and-white texts.
- In addition, while reading an important document, 39% of readers like to find critical information in a visually appealing and highlighted format through visuals rather than camouflaged amongst the plain text.
Enhances Engagement and Sales

- According to a report by HubSpot, posts with engaging visuals or attractive images generate an engagement rate 650 % higher than plain-text posts.
- Besides, it takes approx. 50 milliseconds to create a lasting impression in a user’s mind.
- Thus, it is comparatively much more accessible to leave an impression through visuals with text rather than only text, as it takes time to read and process.
Drives more Likes and Shares on Social Media Platforms
Based on numerous studies, these conclusions have been drawn:
- An impressive 74% of marketers now use visuals in their social media posts because they know how much they grab attention.
- Infographics are compelling and are shared 3x more than any other type of content.
- On Twitter, adding an image to your tweet could make it 150% more likely to be retweeted. It’s clear that visuals, particularly infographics, make your social posts pop!
Get Visuals that Skyrocket Your Sales by 3X Today!
Ready to bring your content to life? Head to Visual Best and see how our Infographic design services can take your brand to next level. Let’s create something visually stunning together and make your story heard, seen, and remembered. Get in touch with us today and watch your content shine!